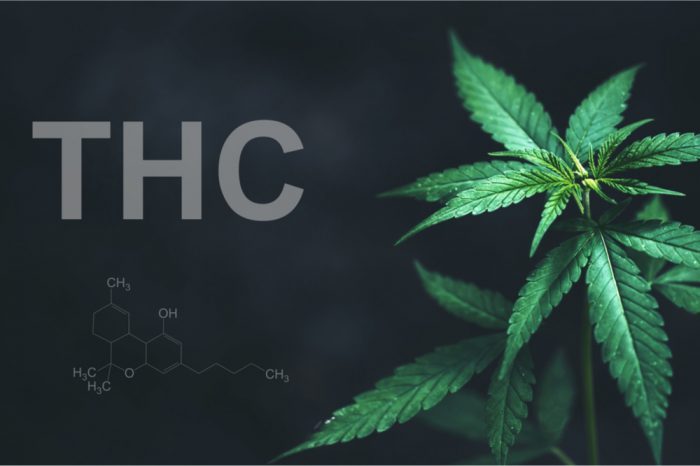
Labels declaring THC Potency, as indicated by a THC percentage chart, may not be an accurate THC calculator.
In the regulated cannabis space, the market has trained consumers to check for THC potency. Dispensaries, online retailers, and even online databases list products according to tetrahydrocannabinol (THC) and cannabidiol (CBD) percentages. But, these numbers are misleading to everyone but trained chemists. The industry as a whole needs a better understanding of available THC, THC dosage, and a how to create a useful THC percentage chart.
To the untrained eye, the THC on a label seems a perfect prediction of potency. But, the problem with our understanding of potency is multifaceted. First, cannabinoids are never stable. Exposure to the elements often leads to degradation and transformation into other cannabinoids. Second, few people realize that the “Total THC” listed on a flower is, at best, a good estimate. Even more, a wide range of error is allowed. Third, the available THC dosage has as much to do with the product as it does with how you take it.
The industry is evolving, and in time, this may lead to the development of an accurate and true THC mg dosage chart that is useable for every consumer. But until then, patients and recreational consumers should learn how to interpret content and do some quick calculations (more on that in a minute).
Cannabinoids Chemically Change Very Easily
Cannabinoids are volatile compounds produced by cannabis plants. In fact, cannabinoids begin their transformations during cultivation, and basically never stop. For example, all cannabinoids begin life as cannabigerolic acid (CBDGa). Over time, and after exposure to heat, oxygen, and UV rays, this ‘Mother’ cannabinoid transforms into tetrahydrocannabinolic acid (THCa), cannabidiolic acid (CBDa), and cannabichromenic acid (CBCa).
All three of these precursor cannabinoids, THCa, CBDa, and CBCa, eventually turn into their more recognizable forms: THC, CBD, and CBC. Generally, this transformation mostly happens during the process of decarboxylation. This is more commonly called decarbing. There is, however, some THC present in ‘raw weed.’
Burning, vaping, or baking cannabis flowers are the most frequent and purposeful methods of decarbing. However, this process may slowly begin during curing and storage.
A rundown of a complete cannabinoid transformation wouldn’t be complete without mentioning cannabinol (CBN). Although overripe flowers may exhibit some measure of CBN, this cannabinoid is typically only associated with older post-harvest products. Aging, UV exposure, and high heat will encourage THC to degrade into CBN. According to the European Industry Hemp Association, “The THC degradation to CBN can already be considerable at temperatures between 85 – 100 °C.” This means that storage is everything in the preservation of THC potency.
How Much THC in Weed: Is THC Potency Accurate?
It’s common to see all flowers labeled with a THC and CBD percentage, but the accuracy in these numbers is highly suspect. Consumers, and even budtenders, likely assume that a flower with twenty-two percent THC translates into twenty-two milligrams of THC per one gram of flower. That is absolutely NOT true.
Cannabinoids are a continually moving target. Genetics and environmental conditions lead to the developing cannabinoid profile during cultivation. After harvest, curing, storage, and handling, the final profile could shift again. Even under ideal conditions, cannabinoids slowly degrade from acidic versions, into active compounds, and eventually into CBN. This natural process is why it’s incredibly challenging to stick a simple number on the label to indicate total potency.
Be Your Own THC Calculator: How to Calculate THC Percentage
Cannabinoid degradation aside for a moment, let’s assume that cannabinoids are stable from harvest to consumption. The THC percentage indicated on labels is technically a calculation that may consider THC, THCa, conversion, and molecular weights — or none of the above. There are currently three separate ways through which labs may calculate this number:
- %THCa + %THC = Total THC
This method is simplistic, and therefore, highly inaccurate. Under this scenario, the total THC combines both inactive and active forms of THC. The calculation adds these two numbers together to create a total THC calculation. Unfortunately, this doesn’t take into account molecular weights or the generally inaccurate conversion of THCa to THC during consumption.
- (0.877 x %THCa) + %THC = Total THC
This is a more accurate calculation and one which Canada uses in its regulated market. Under this method, the amount of THCa is adjusted for the difference in molecular weight with THC. Although this is definitely a more complicated picture for the consumer to grasp, it’s a more accurate representation of potency.
- (0.75 x 0.877 x %THCa) + %THC = Total THC
A final method is the most complicated and the least used. It builds on the molecular weight and takes into account the imperfect transformation of THCa into THC. Under the best conditions, only about seventy-five percent of THCa will turn into THC. Because most consumers are still chasing products based on THC potency, this is the least desirable number to display as it will always be lower than the other two options. Still, it is the most accurate.
Total Available THC and Route of Administration
The final consideration for anyone seeking a real indication of available THC in any given product is the route of administration. The science of bioavailability is an in-depth topic, but in brief, the administration route matters for how many cannabinoids the human body absorbs. Vaping, smoking, edibles, and sublingual applications all have different bioavailability rates, which will impact the final experience.
According to an older review, published in 2007, cannabis smokers typically absorbed two to twenty-six percent THC from inhaled cannabis. The large degree of variation is thanks to “intra- and inter-subject variability in smoking dynamics, which contributes to uncertainty in dose delivery.” Newer assessments have estimated smoking delivers a higher rate of absorption, around thirty-five percent.[1]Huestis M. A. (2007). Human cannabinoid pharmacokinetics. Chemistry & biodiversity, 4(8), 1770–1804. https://doi.org/10.1002/cbdv.200790152
Although several new research assumes the bioavailability of vaporized cannabis is similar to that of smoking, vaping is less understood. The high degree of variability between participants is also likely.
Oral routes (as in edibles), are the least available, as cannabinoids are hydrophobic and are not readily absorbed through the digestive tract. According to the 2007 review, edibles and other oral delivery methods have somewhere between a four to twenty percent absorption rate, with many influencing factors.
A Final Example of True THC
It’s not easy for the average person to grasp the true potency of cannabis. For starters, there is no straightforward THC percentage chart detailing cannabinoid degradation, molecular weight, cannabinoid conversion expectations, and chosen route of administrations.
The best explanation is a real-world example. According to a White Widow lab report, this strain contains 13 percent THCa and 2 percent THC as a percentage of dry weight. Assuming this strain had zero percent degradation over time, what total THC is available to the consumer?
Let’s use the most complicated, but most accurate formula: (0.75 x 0.877 x 13%) + 2% = 10.6% Total THC.
Using the most simplistic calculation of total THC, it would reap 15 percent (THC + THCa). But, based on the most accurate, it sits at almost five percentage points less, at 10.6 percent total THC.
Routes of Cannabis Administration
Again, none of these calculations take into account the route of administration. That automatically reduces the available THC, in some cases, down to significantly lower levels.
Consumers are slowly adapting to the big wide world of cannabis science, but there is a long road ahead when it comes to accurate potency interpretation. These days, all products may openly display THC and CBD content, but these numbers don’t paint a complete picture.
Consumers, and even most budtenders, need a THC percentage chart that clearly and simply breaks down the math so even a layperson can understand every product’s potency.
References


